
Have you ever wanted to showcase your Facebook ad creative performance but ended up with something that looks like this:

Whilst this table is great at showcasing the overall performance of each ad, it falls a bit flat by not showing what the ad looks like visually. It’s also highly unlikely whoever is reading this report will be able to relate to the creative in use.
If the goal here is to communicate the success of creative, my take is this just doesn’t really do the job. I wanted to be able to not only showcase ad performance, but also wanted to be able to add real context in terms of seeing the creative in situ.
If you’ve ever had questions from stakeholders or clients such as “which ad creative are we currently running?”, “how do I quickly see which creative is working?” or “am I able to see previews of all our ads from last week?” keep reading as I’ll show you how to visually improve your Facebook ad creative dashboards and take them to the next level.
Through the power of Supermetrics (if you’re a regular reader of our blog or listener of our podcast, you will know how much we love Supermetrics) and Google Data Studio, it only takes a few steps to be able to transform your creative dashboards. Here’s how you can do it:
1. Make sure your Facebook ads account is connected as a Data Source in your Data Studio Report
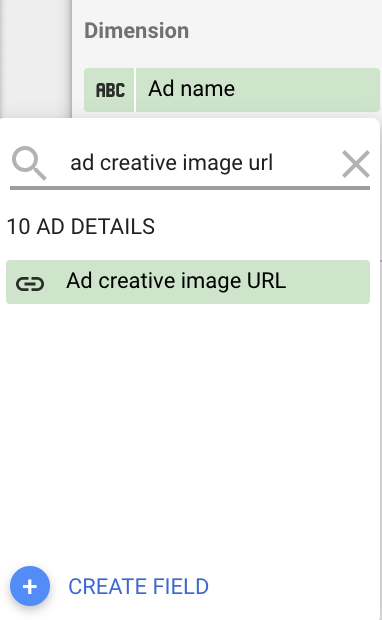
2. In the dimensions, select Ad creative image URL. The default setting will show the image URL in your table.
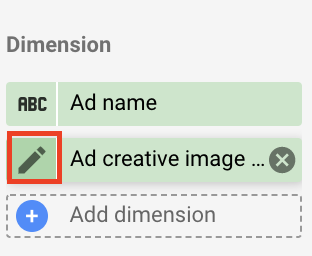
3. To get the creative image to display, you need to click the icon next to the dimension to be able to edit it.
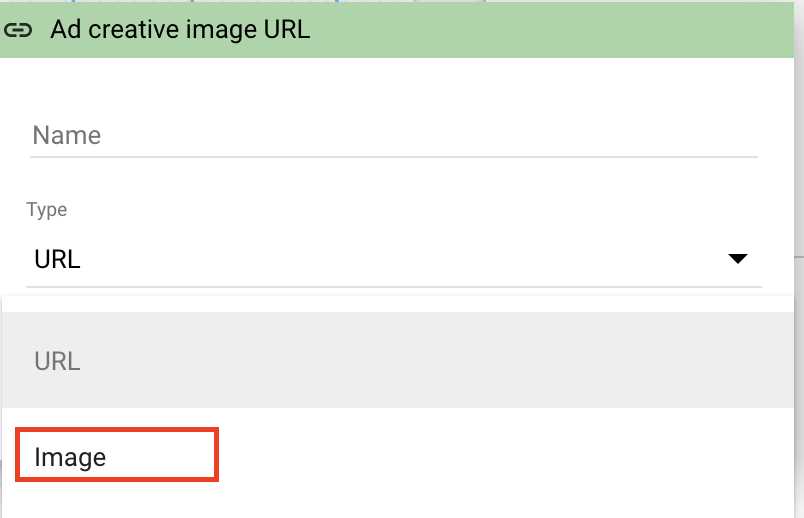
4. After you have clicked to edit, you will need to change the setting from show as ‘URL to show as ‘Image’.
5. Voila, your ad creative will now be displayed in your results table.

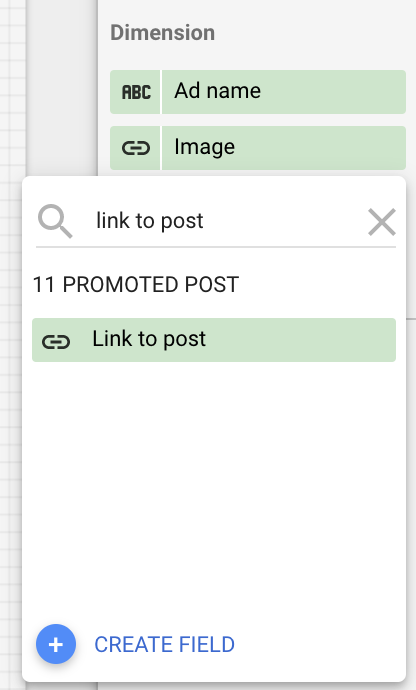
6. The next step will be to add a preview link next to your ad name and image. To do this you will need to add an additional dimension ‘Link to Post.’ Once this is selected you will now see a link to preview the Facebook ad.
And there you have it. With Supermetrics to hand and a few simple steps, you now have everything you need for improved creative reporting.

By providing this information, everyone has a transparent view about not only what the performance of the ads are, but also the creatives currently being used across the account.
If you’ve ever had a stakeholder or client want a full 360 overview of all the ads currently running in the Facebook ads account, you could easily use these fields to build out a dynamic Google Sheet of all active ads. This could then be automatically refreshed weekly or monthly.
I hope you find this useful. It’s really transformed how our clients engage with us about the types of creative that are working and opens up a lot of more positive conversations about creative testing as a result.


