
When looking to improve performance, finding inefficient areas to cut is just as important as finding winning elements to increase spend on.
The fundamentals of paid media all centre around making solid and sensible decisions with spend. Cutting waste is clearly good, no one enjoys throwing cash away, but it also allows you to invest more in what’s working. Do more of what is working and less of what’s not. Simple!
Given the importance of identifying areas of wasted spend, I thought I’d put together a quick post on some simple ways to dig out inefficient areas in your account and therefore improve your ability to win gains in overall performance.
The first thing you’ll need to do is get some simple benchmarks in place to understand what quantifies success or failure. Typically, this is based on a profitable CPA, ROAS or cost per lead but will clearly be very different for every business.
Once you have a set of benchmarks you can then apply filters to your account to show which campaigns, ad sets and ads sit above or below your target. Doing this means you can quickly see which areas need further investigation.
A word of warning – the ability to set filters on CPA, ROAS and CPL across all your data can be a bit limited in the Facebook Ads Manager. As such, it can make sense to export your data first if you want to go into lots of detail. If you want to go down this route, then being comfortable with the basics of pivot tables should be all you need to get some decent insights.
The task from here is to investigate why performance in certain areas is lacking and to make a decision on whether you feel performance can be saved, or if it’s better to bin the ad set / ad and move onto something else.
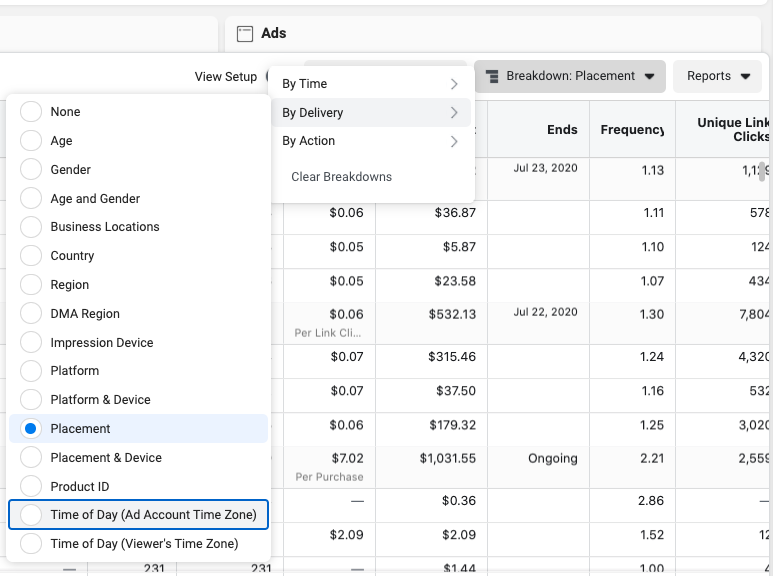
To do this, here’s a handful of areas worth looking into. All can be found via the ‘Breakdown’ menu in the main reporting screen.
Placements:
My first port of call when looking at a new account is choice of placement and a breakdown of performance on each.
This is a really simple check and all you need to do is select ‘Placement’ within the menu. You can then scroll to the bottom to get an overall performance breakdown across all campaigns.
You can either do this to get a view on the bigger picture, or also view individual campaigns or ad sets across placements. My starting point is to look at complete performance to spot bigger trends and then dig into individual ad sets to start trying to spot patterns.
At the same time, I’m also looking for the relationship between spend and performance. If ad sets have been created with multiple placements, the spend distribution will be left to Facebook and I want to know if budget is being distributed appropriately.
Audiences:
If you’ve got your account organised sensibly and your naming conventions in good order, assessing audience performance should be easy.
A word of warning, particularly if you’re using campaign budget optimisation – always make sure there’s a good amount of spend on an ad set before coming to any conclusions. You might be seeing amazing performance on one ad set, but if you’ve only spent £10 then you’re likely nowhere near statistical significance.
My approach here would be to line up all my ad sets, filter down to ad sets that are not hitting my CPA / ROAS targets and then order by spend. I can then quickly see the worst offenders.
When assessing audience performance, it’s really important to also look at trends over time. It’s good to get an overall figure, but you also need to know if there’s been a recent trend of increase / decrease to know if you’re looking at a knackered audience.
Demographics:
Looking for areas of waste within your demographic data is always going to be a good choice and should identify some juicy insights.
By default, when setting up a new ad set Facebook will automatically select all age groups and both genders.
As with the placement breakdowns, to get a view on performance by demographics simply navigate to the ‘breakdown’ menu in the top right of your main reporting view. You can then either select age, gender or both age & gender together.

In most accounts we review there is almost always some degree of waste amongst age or gender.
Country & state breakdowns:
As with demographics, if you’re targeting multiple countries in one ad set you’ll definitely want to get a sense of performance on each. Also, if you’re advertising in the US, performance is going to vary quite a bit from state to state.
What we see frequently when grouping different locations is either one country taking the lion’s share of the budget or other countries spending but not performing.
If certain countries or states just aren’t getting any budget then it might be an idea to pull them out into separate ad sets to see if with some spend they can perform.
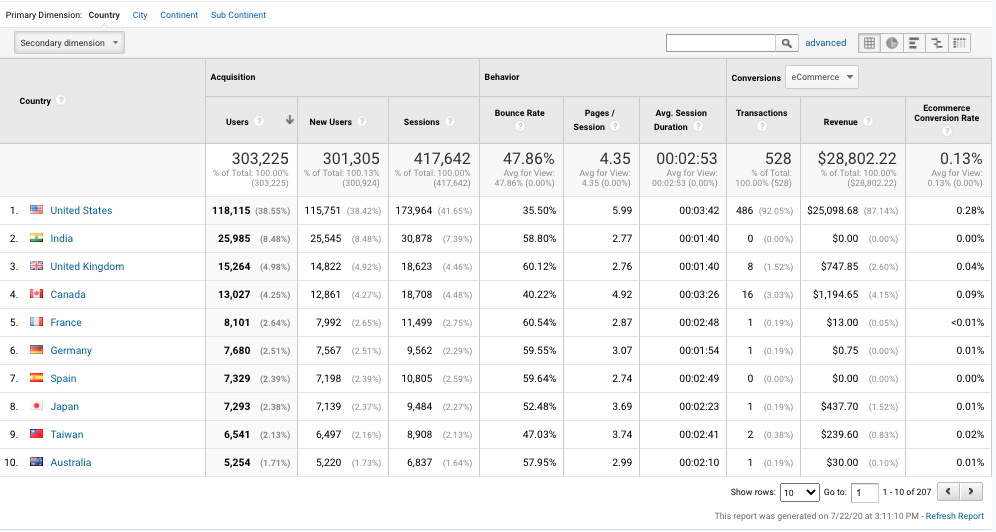
When looking at country / state performance it’s always a great idea to cross check your findings in Google Analytics. If you’re seeing low results, is this a wider challenge or something unique to Facebook Ads? Being armed with this information will really help your decision making.
Hopefully the above helps – four simple ways to quickly start digging into performance issues and finding ways to make your budget go further.