
If you’re using Google Data Studio for your reporting, you’ll know how powerful a tool it is. But even with so many features and functionality, I do still stumble into some issues where I am asking myself “there must be a way to do that?” And the majority of the time, there is.
With this in mind, I wanted to share with you the 3 Google Data Studio hacks that changed my reporting.
Applying Filters
Have you ever had a table and wanted to manipulate a graph to only display a particular row in that table? For example, you have a table of the top-performing creatives from 2020 but you want to drill down into monthly performance for each creative individually without creating multiple graphs for each ad.
This is where the ‘Apply Filter’ functionality will become your best friend.
To find this setting, once you have created your table, scroll down to ‘Interactions’ and select ‘Apply Filter’.
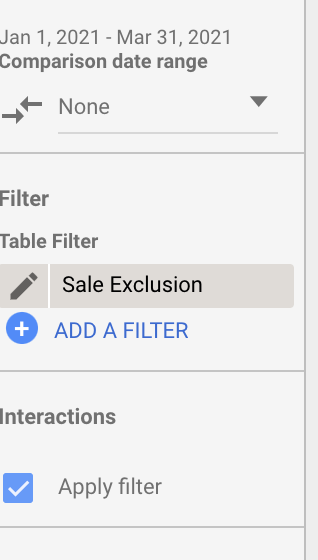
The table will now be interactive and you will be able to filter the graph by a particular row and populate it with the relevant data.
This is a feature that is so handy to understand trends over time as part of our creative analysis.
Removing Landing Page Query Parameters
If your Google Analytics property is not set up to remove query parameters from URLs or you are unable to remove them yourself, it can be difficult in Data Studio to get a full picture of landing page performance if the query strings from various platforms are included e.g fbclid.
Luckily there is a way to easily do remove these within Google Data Studio.
Firstly, you will need to add a new field to your data source:

You will then need to create a field using the following formula:
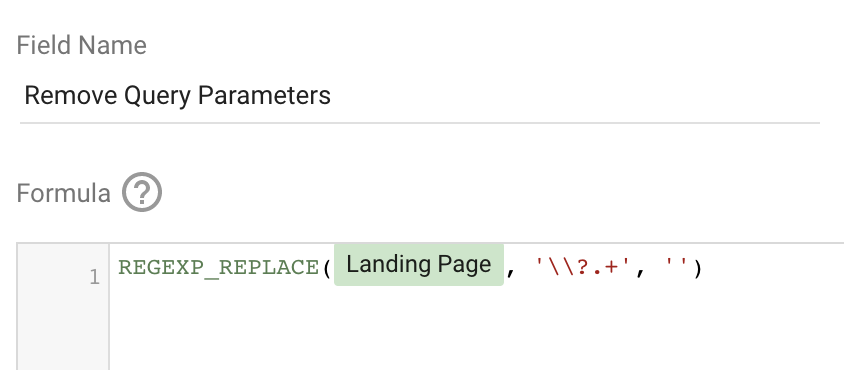
Using the formula will remove any query parameters you are using in Google Analytics and will aggregate the data together, providing you with clean information all in one place.
Creating Custom Metrics
I previously wrote about how you can create custom metrics with Facebook Ads itself. Unfortunately, these are not easily pulled into Google Data Studio, so these would need to be created again for your reports.
These custom fields are a great way of providing more insights for your client. For example, AOV is not a standard Facebook metric. However, this is simple to create in Data Studio.
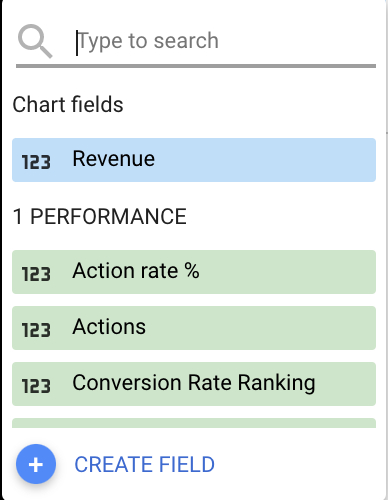
Firstly, select metrics and ‘Create Field’
You can then enter any formula you like to create a custom metric. For this example, we are creating an average order value formula, which is total revenue divided by total purchases.
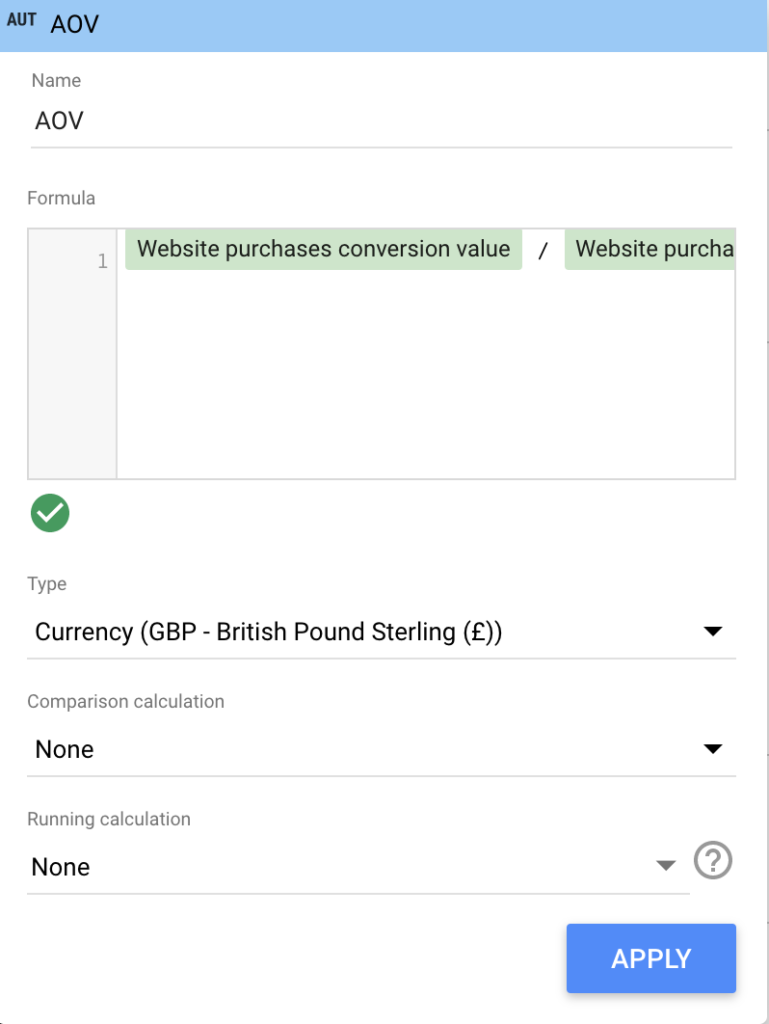
Once you have entered the formula, select the currency you want the AOV to be formatted in and apply your new metric to your reporting – it’s as simple as that.
And as a bonus hack, one of my previous blogs highlighted how you can visually showcase your Facebook ad creatives in Google Data Studio – our clients love being able to see the creative thumbnails whilst looking at top-performing creatives. It is also really useful when you are sharing this information with internal creative teams as well. It’s definitely worth 5 minutes of your time.