Before setting out an optimisation strategy, it is key to understand how long it takes people to convert after seeing or clicking on your ads. Not only does it deepen your understanding of how people interact with your campaigns, it also helps to clarify points such as how long to run your tests for.
To give a practical example, if people typically convert on the same day as clicking your ad, you can run a test and know within a day or so if it’s working. If people take longer to purchase, say seven days, in order to get a clear view on what’s working you’ll need to give your campaigns a bit more time before making a call.
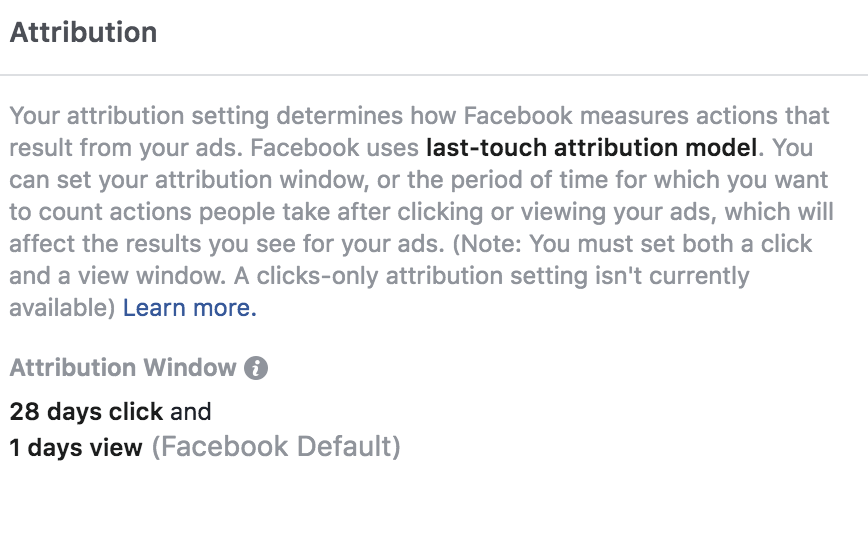
Before we go into the details on how to review purchase windows, it’s important to clarify the standard attribution set up in the Facebook ad manager. By default, standard attribution is set to a 1-day view or 28-day click. That means if someone views your ad and purchases within the same day, you’ll get the credit. Or, if someone clicks your ad and purchases within 28 days, you’ll be credited. Attribution windows can be adjusted in your account settings, but this is the default set up.

(reviewing attribution settings in your ad account settings)
It’s also worth pointing out that if someone takes 10 days to purchase after clicking your ad, the revenue will be assigned to the day the last ad was clicked. Not the day the purchase took place. Therefore, if your customers typically take longer to purchase you can expect revenue data to lag slightly and update over time. It’s worth knowing before you make any big decisions.
How do I see this data?
One of the most enlightening things about getting to know the Facebook ad manager is just how much data is available. In this example, let’s say you are running a conversion campaign and want to review the split between conversion windows (1 day, 7 days & 28 days).
To see the data in your campaign, ad set or report view take the following steps:
- Open up the ‘columns’ drop down
- Select ‘customize columns’
- In the bottom right, click ‘comparing windows’
- Select 1 day view, 1 day click, 7 day click and 28 day click
- Click ‘apply’
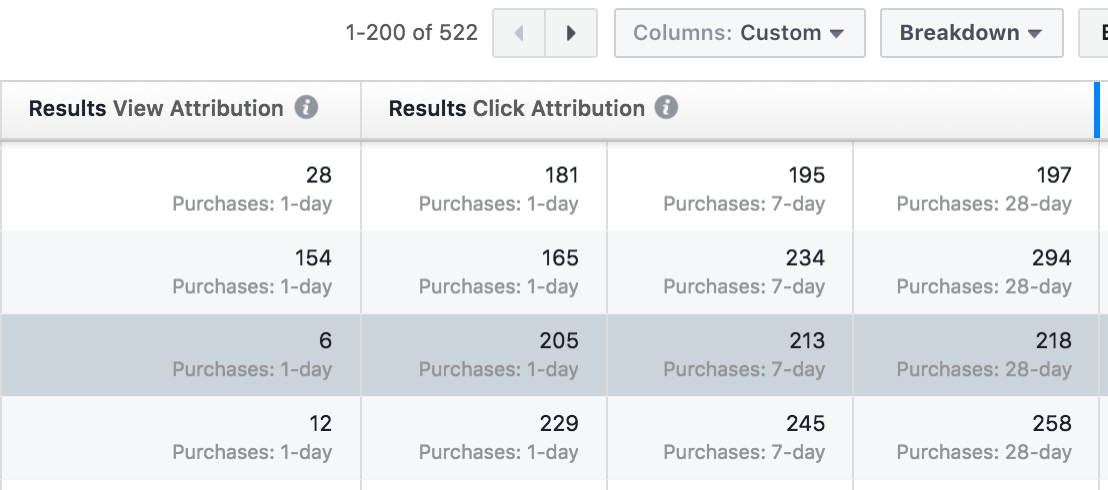
The result is the report below, showing you how many people purchase within 1 day, how many within 7 days, and how many people purchase within 28 days. Note that the figures accumulate, so the figure in the ’28 day’ column is your total purchases within 28 days, not just the number of people that purchased within days 8-28:

Export and Pivot in Excel
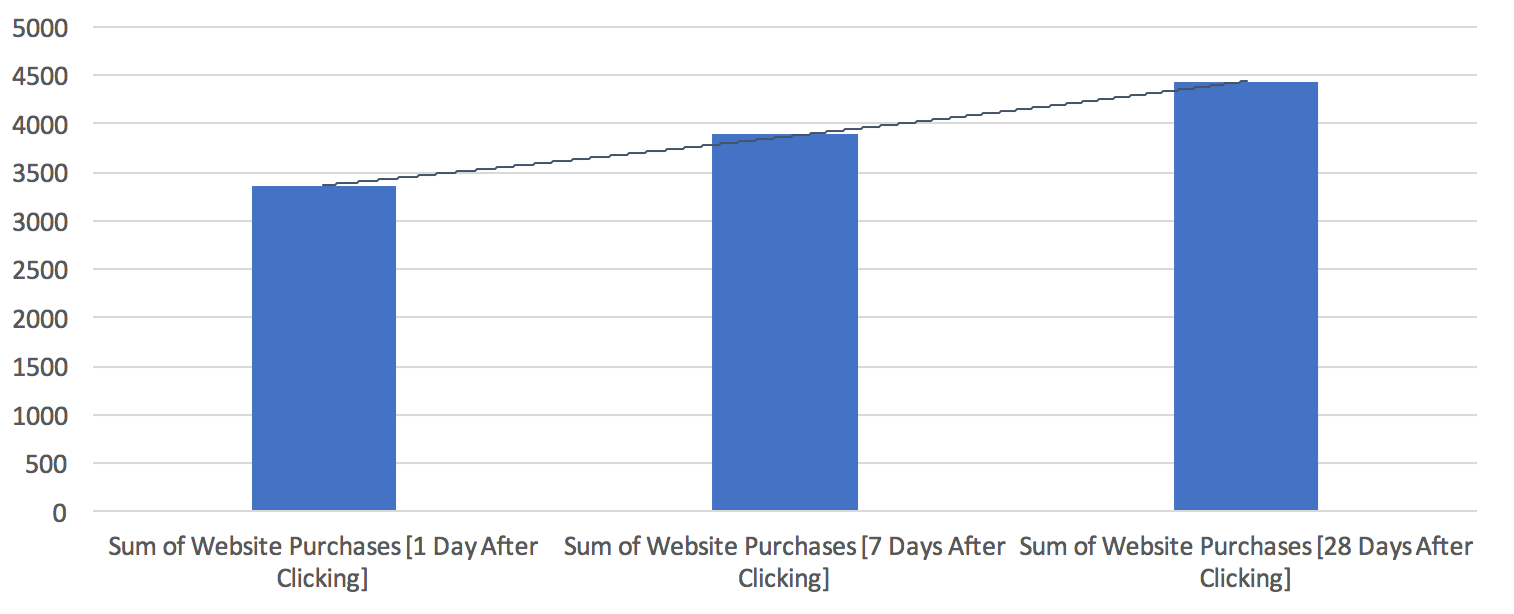
To get an overall view on purchase windows, extend your time period to get enough data. You can then export your campaign view into Excel and have play around with pivot tables to easily visualise patterns.
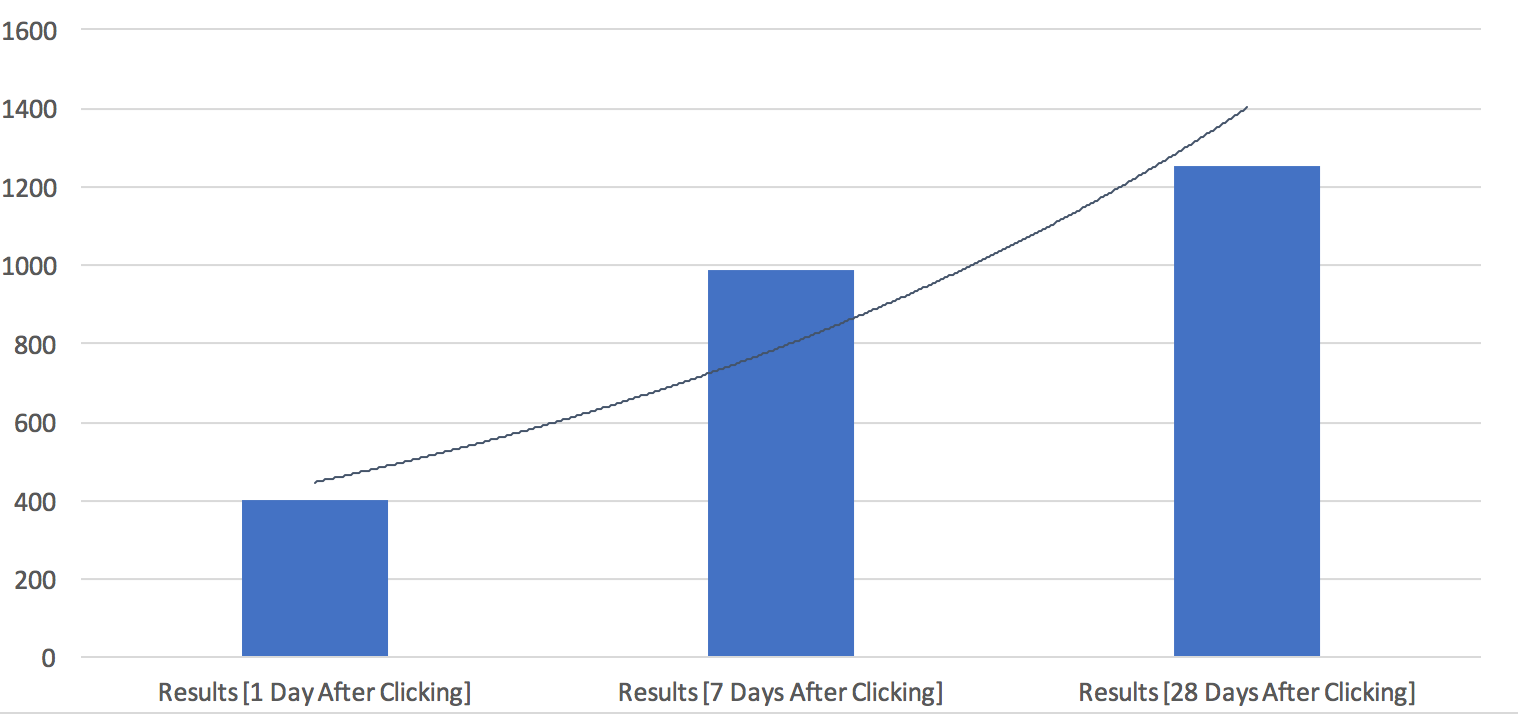
Remember, the steeper the curve, the longer it is taking people to purchase:

This starts to get really interesting when you break it down to individual audiences. In the example below, the particular audience in question was doing a great job, it was just taking a bit longer to convert than other ad sets in the campaign:

Armed with this information, you can start to look at why any audiences/ad sets might be performing out of character with the rest of the campaign and make adjustments accordingly.
In the specific example above the ad set in question was part of a dynamic product retargeting campaign. By creating more specific product sets in the product catalogue, the conversion window reduced; i.e. we were able to speed up the time to convert by taking a bit more control over which products were served.
This process can be repeated for any campaign type or ‘event’, it doesn’t just have to be purchases.
For example, if you were running traffic campaigns to a blog or guide content with the desired outcome being an enquiry form completion, this process would tell you not only which audiences result in the greatest volume of enquiries, but also which audiences tend to respond or act faster. All very interesting and useful stuff.


