
Google Data Studio is a powerful tool for any company looking to display digital data using interactive dashboards. The fact that in many cases this free tool trumps paid for dashboarding suites is incredible.
That being said, once you venture beyond needing to report on Google products (Google Analytics, Google Ads and so on) it can get tricky understanding how to connect the platforms you’re working on (looking at you Facebook!).
One particular case we came up against recently was when rather than using standard conversions such as purchases or leads, a client’s conversion reporting in Facebook relied solely on custom conversions. Sadly, when connecting to Google Data Studio no metric exists for custom conversions so a work around is needed.
This guide shows you exactly what you need to do when you want to show specific custom conversions within your reporting and not just a total. In our example, the client was only interested in our reports showing quotes started and not a combination of the three separate custom conversions that were being tracked.
Step 1: get a connector
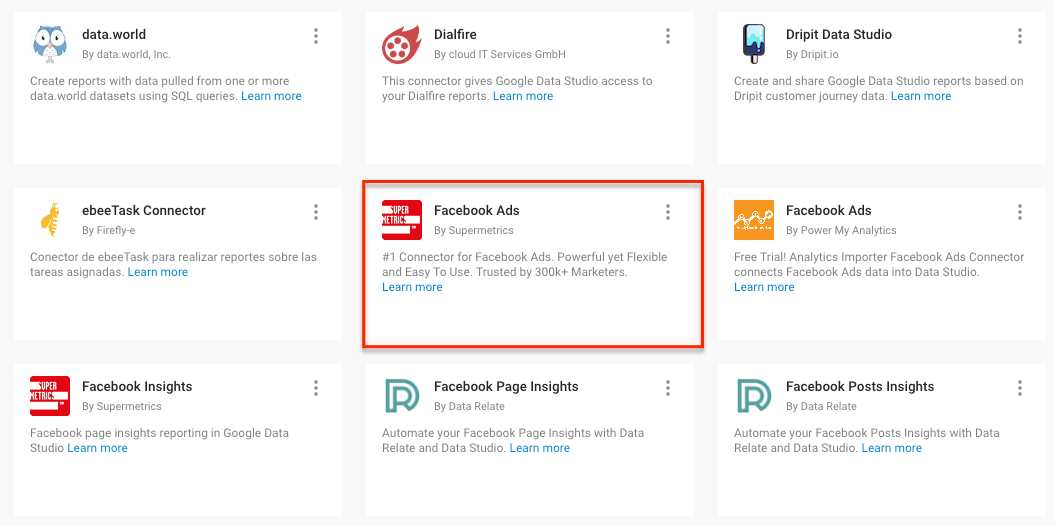
The first step is choosing your method for connecting Google Data Studio to Facebook Ads. There are several connectors available, however our tool of choice is Supermetrics.
Supermetrics offers a couple of different options; either use their Google Sheets plugin to pull data in a sheet which you can then import into Data Studio, or secondly connect directly to Google Data studio and bypass Google Sheets.
The choice is entirely yours and is completely down to how you work. Personally, I find being able to pull data into sheets is extremely useful for monitoring/analysis whereas the connection directly from Data Studio to Facebook Ads makes client reporting a breeze. As such, in our case we use both.
Step 2: find your custom conversion IDs
Next, you need to do is to get your custom conversion ID’s from Facebook. To do this log into your business Facebook account, hit the top left tab and go to ‘Custom conversions’
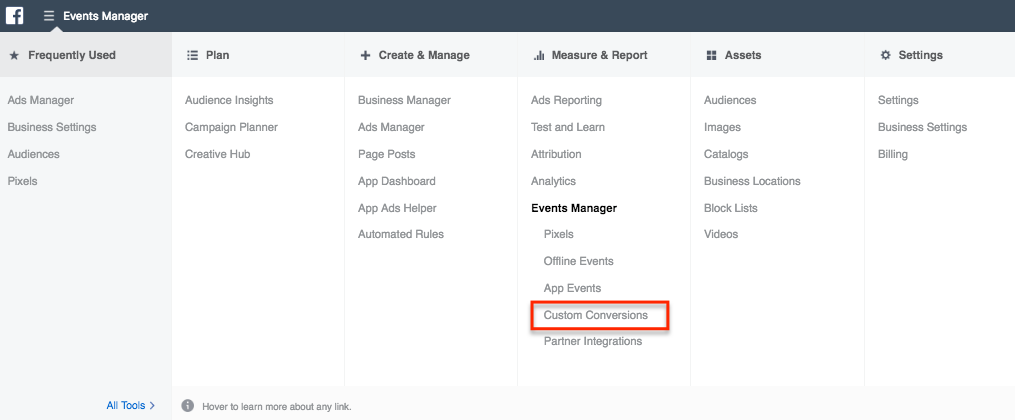
You then should see a list of your custom conversions alongside an ID number for each one. These ID’s are going to be needed later, so keep the page open for now.
Step 3: reporting via Google Sheets
As a first example and going with the option of pulling the data into Google Sheets first, your first port of call is to create the sheet that will house your report.
Once into your google sheet, open up Supermetrics (‘Add-Ons’, ‘Supermetrics’, ‘Launch Sidebar’) and input the following:
- Data Source: Facebook Ads
- Select Account: Select the account you want
- Select Dates: Select the data range that you wish
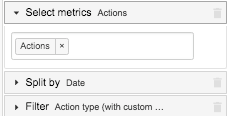
- Select metrics: Within the Metrics tab you will need to add ‘actions’ (under the performance subset)
- Split by: Date
Doing the above will essentially create a report with a ‘total’ number on custom conversions, but the point of this post is to show you how to report on individual custom conversions.
For this, we need to create a filter which is where your conversion ID numbers from earlier come in: add ‘Action type (with customer conv. ID’s)’ then Contains then the ID of the conversion.
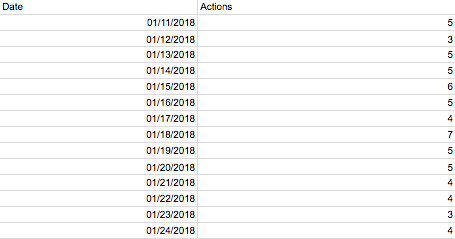
You will then end up with a table that looks like the below. The Actions column is then the number of times the custom conversion you’ve specified has been successfully completed. This can then be used within Data studio report to pull in the correct conversion data that you wish to use or of course remain in Google Sheets if you wish.
Step 4: connecting directly to Google Data Studio
Here we are going to show you how to connect directly to Google Data studio and bypass Google Sheets entirely using Supermetrics partner connector.
Within a new Google Data Studio report follow these below steps.
- Create a new data source (bottom right corner).
- Select the Facebook Ads connector
- Select the appropriate account and hit connect.
Note, we can now title your data source which is found above the Edit Connection tab.
- Click add to report.
Now we have the correct data source added to the Google Data Sheet you will need to setup the tables, graphs or callout boxes that you are using to display the correct information. Of course, just as with the Google Sheets method we will need to create and apply filters to display your custom conversions metrics.
First things first, create a table, graph or box that you want to display your data within Google Data Studio. Once you’ve added this to your template follow these steps:
- Data Source: Added Data Sources (select what we added in step 4).
- Dimension: Select the level of the account you want to display. E.g. Campaign name
- Metric: Website Custom Conversions
This will now only display all the custom conversions split by each campaign in the account. Now we ideally want to split these conversions into their individual elements so we can see separate customer conversions rather than a total figure.
To do this we will need to add a filter:
- Click onto the table
- Scroll down to Add a Filter
- Name your filter
- Action Type (With custom conv. ID’s)
- Condition: Equal to (=)
- Now enter your custom conversion ID value.
You will need to have as many filters as you do custom conversions. This way you can apply each filter to each metric graph, table or box that you wish to display.
It’s all a bit of a workaround but it certainly does the trick!


