With Facebook’s attribution often being a little on the flattering side, it can be easy to remain in a bubble of comfort and only ever look for performance insights from Facebook data alone.
Monitoring Facebook’s data is of course an important thing that every campaign manager should be doing, however looking at other sources can yield excellent insights and add vital context to any decision making.
Although Google Analytics has certain limits when it comes to measuring paid social (think cross device tracking issues etc), there are a ton of useful ways to analyse performance and get a view that you simply can’t get if you rely solely on data from Facebook Ad Manager.
To get any use at all from Google Analytics in relation to paid social, the first thing you must do is set up a UTM structure that allows you to separate paid social from organic social.
We typically use something along the following lines:
- utm_medium=paid_social
- utm_source=[facebook / Instagram]
- utm_campaign=[Ad Set Name]
With that in place, here’s a few handy things that you can look for!
Time on Site
Finding some way of benchmarking traffic quality is crucial. Finding major differences in the ‘stickiness’ of traffic between ad sets can be a major indicator that budget may need to be re-prioritised, particularly when there’s a lack of volume in the conversion department.
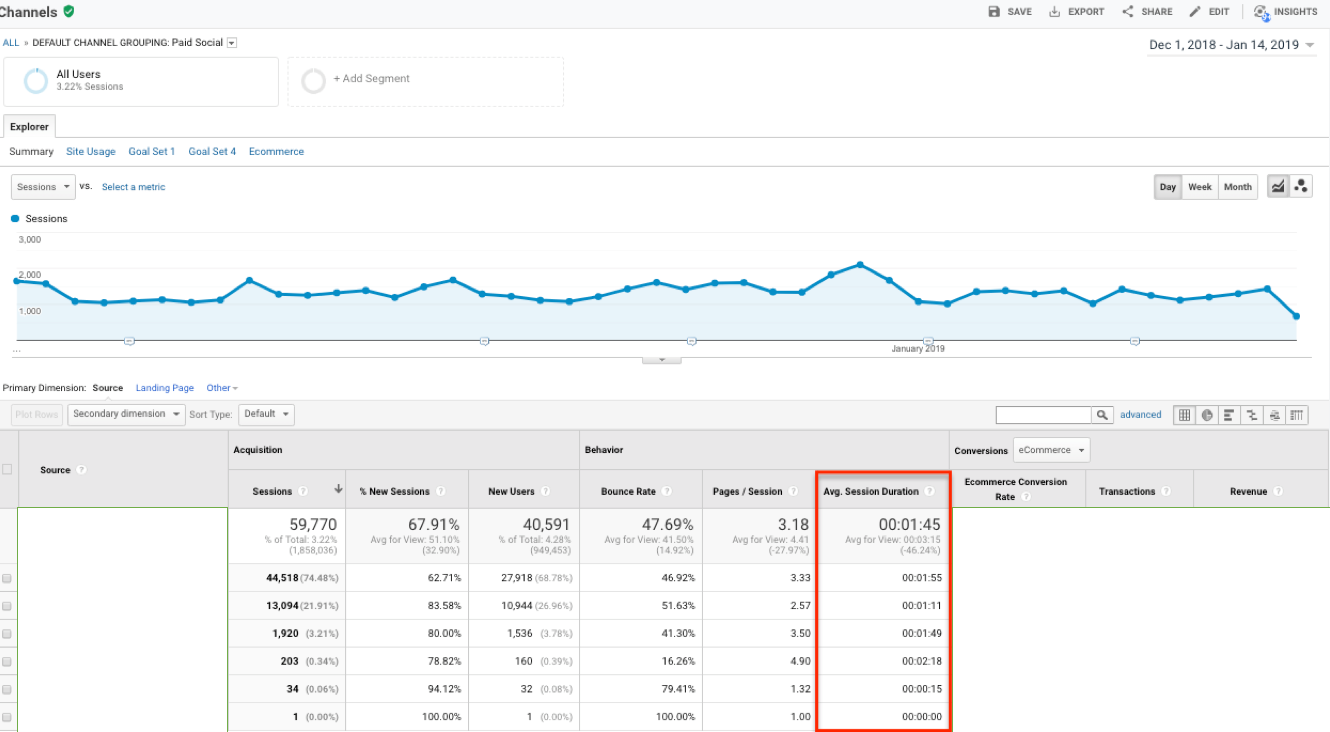
If you’ve got your UTM parameters set up to provide detail in GA at the ad set level, then you should be able to spot differences in traffic quality quite easily.
What can also be very insightful is tracking overall time on site over time, to see if your optimisations are having the desired effect on quality:
Conversion Paths
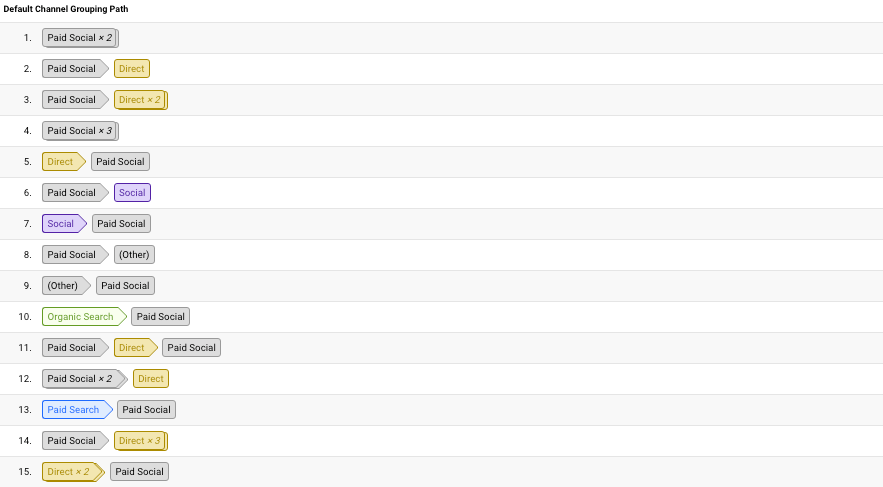
With social often being higher in the funnel and not necessarily a direct converter, it can be super interesting to see where your work sits in the conversion path.
Even if you’re not getting a great return on last click conversions (this is typically the case), you might find that you’re doing a great job of attracting new traffic that converts later down the line via other channels. This is still a very valid job and one that should be noticed!
To do so, head to the Conversions report in Google Analytics, Click ‘Multi Channel Funnels’ and then select ‘Top Conversion Paths’. Once you’re there, filter down to your paid social channel:
First Session from Paid Social
In a similar vein to the point above, what can also be interesting is to get a view on what traffic does subsequently when the first visit comes via Paid Social.
To get this view, create a new segment using the ‘Sequences’ option as follows:

Be sure to select ‘users’ rather than sessions, and make sure you select ‘first user interaction’ rather than ‘any user interaction’.
Once you’ve applied this segment you’ll be able to review all your standard reports, but only seeing behaviour where the first interaction is from Paid Social. This can give fascinating insights on what content is typically viewed, and which other channels people come back and convert by.
Top Converting Landing Pages
It’s not always about reviewing performance of current campaigns, sometimes you need to find improvements, new ideas or simply build a clear view on where to start.
A great first step is to analyse which landing pages typically perform best from other channels. If for example you’re planning a new account for an ecommerce business, it’s extremely useful to understand what areas of the site are going to give you the best chance.
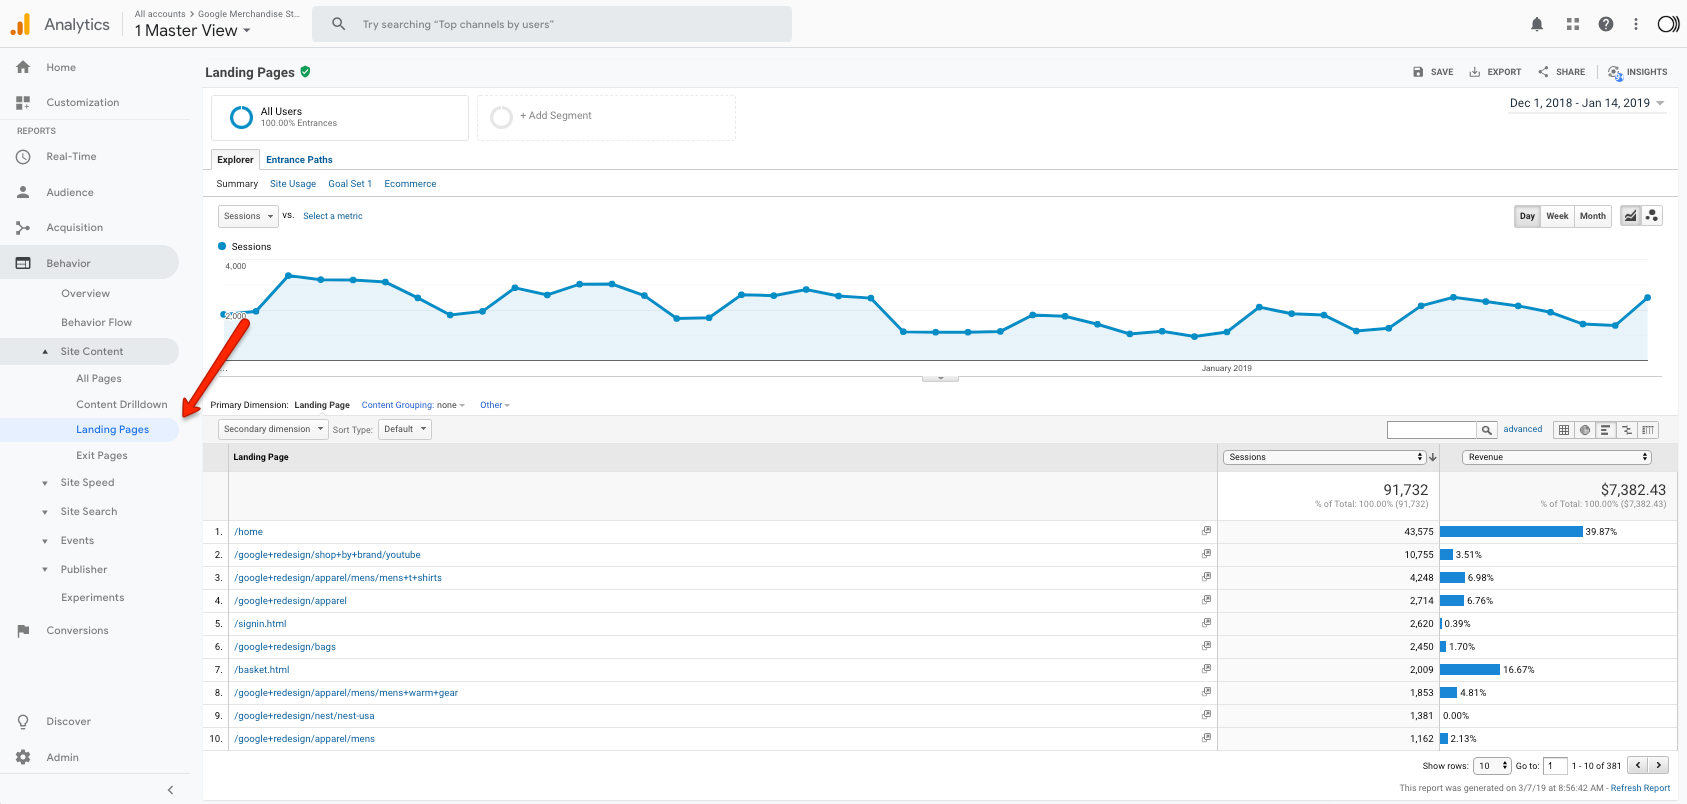
To find this report, simply head to ‘Behaviour’ and then view the landing page report. Once there, sort your data by transaction volume and you’ll have a quick and easy to view list of the top converting landing pages on your site.
These should be a great place to start for your Paid Social campaigns.
Top Selling Products
Similarly, it really pays to keep track on which products are selling. If you’ve been running an account for some time, it’s likely that purchase behaviour is going to change over time, so you really need to have a handle on what’s selling.
As with the point above, this can also be very handy when planning a new account and trying to get a view on which products to start with. Top sellers are always going to be a safe bet:
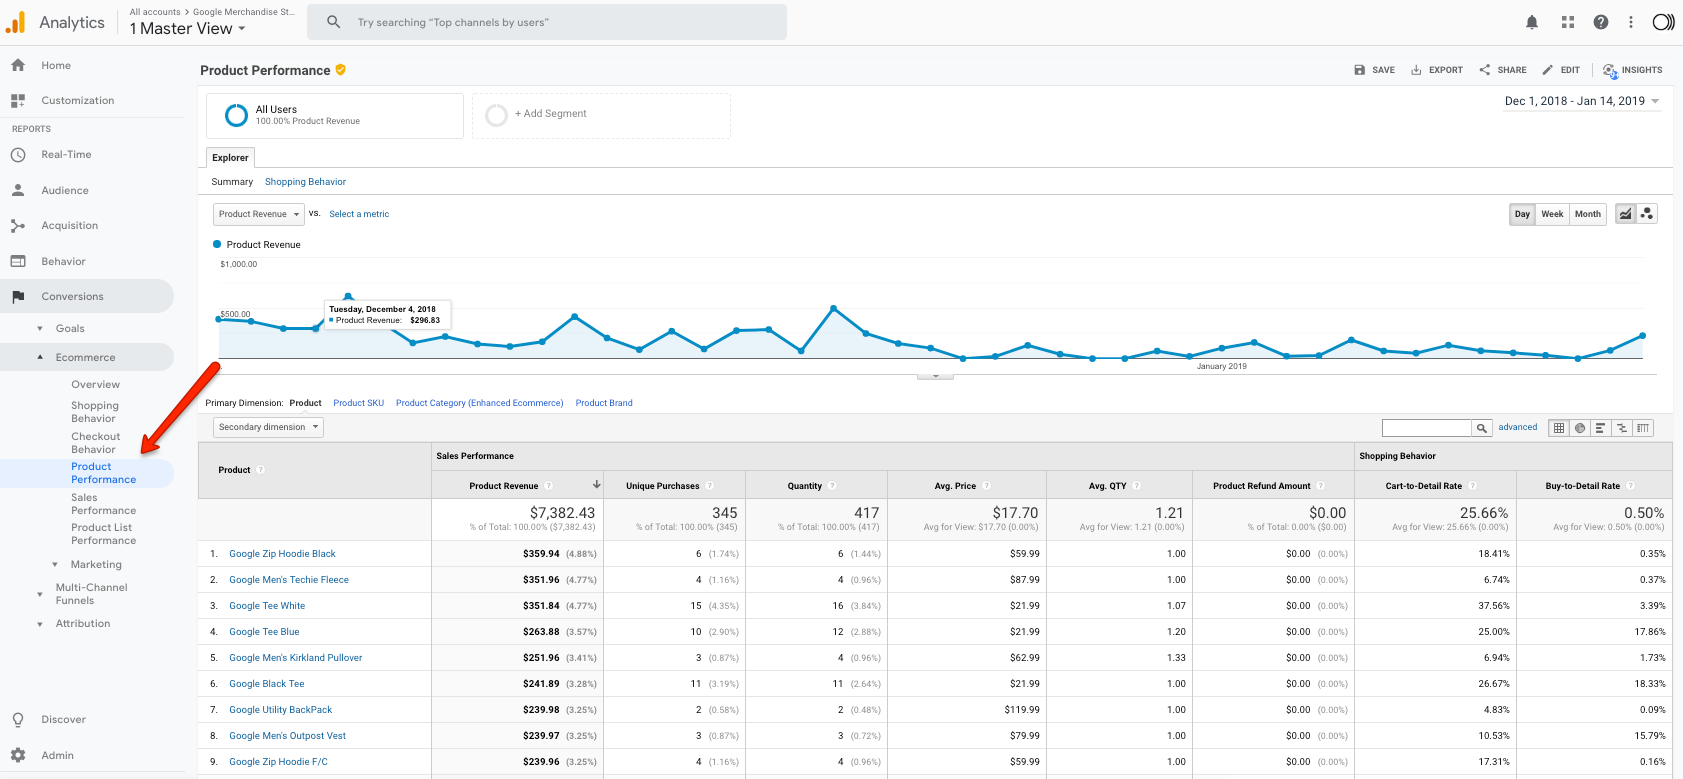
Getting the data above couldn’t be easier, just head to ‘Conversions’ and then view the Ecommerce reports to start analysing sales data.
Seasonality Trends
It also pays dividends to have a clear understanding of any seasonal trends, both in terms of demand (traffic) and sales.
Anyone who’s run Facebook Ads before will know that performance can sometimes be quite spikey, so it’s always really useful to know if this is a wider trend or something that you need to be reacting to within the account itself.
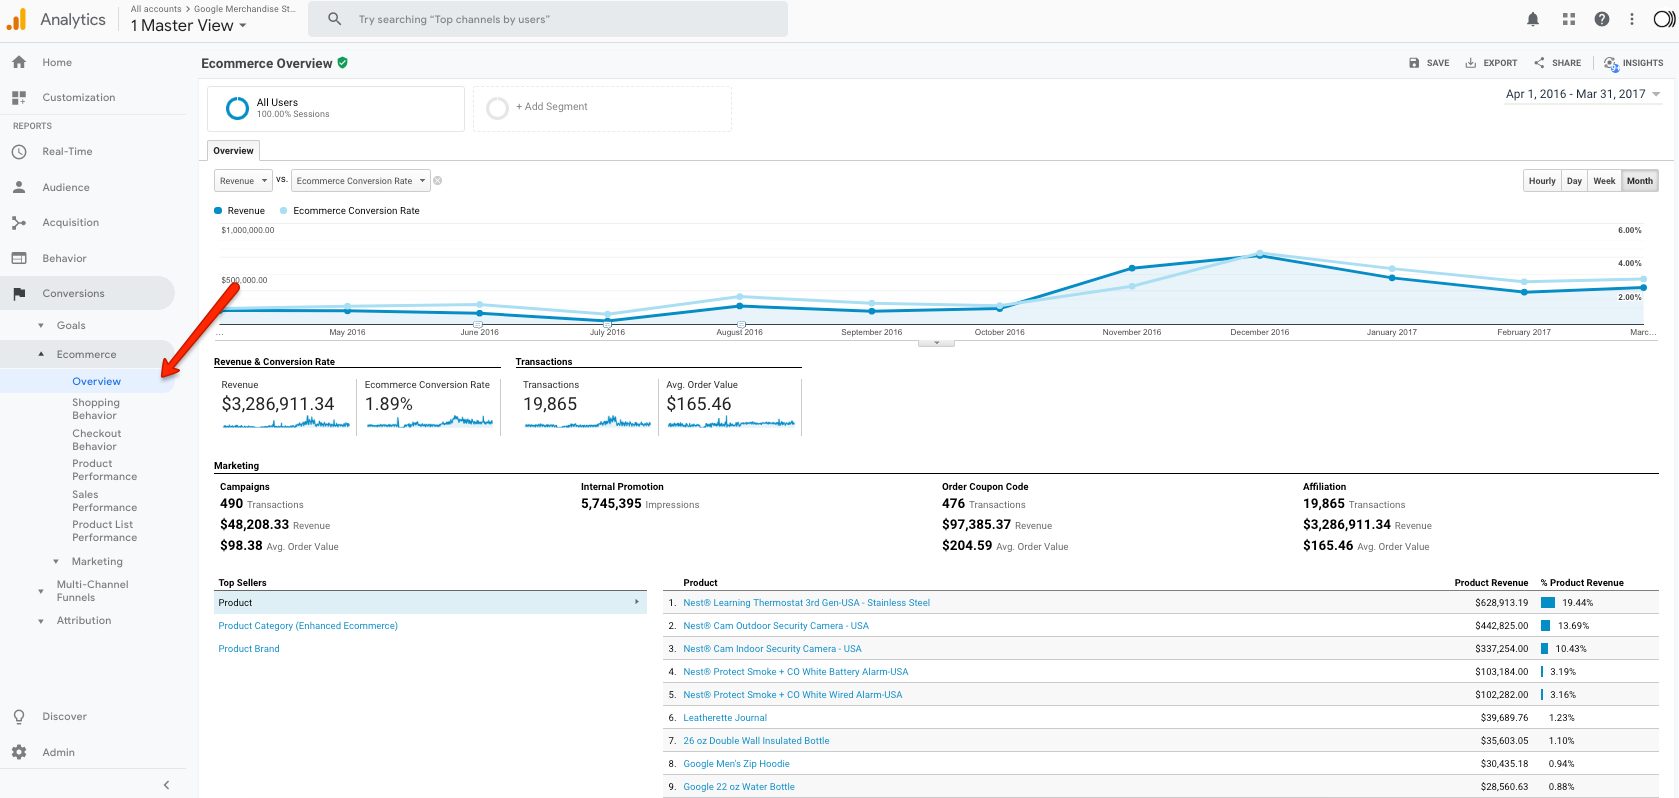
If you’re in the position where you’re planning spend for the year, it makes complete sense to get this view and plan spend accordingly. Obviously, you’re going to want to allocate more spend to peak months, so having this data to hand is only going to mean your decisions are more informed.
Hopefully the above are useful and help you to gain some additional insights for your campaigns. Good luck!


