One of the beautiful aspects of pulling ads data into Google Sheets is automating otherwise time intensive admin tasks. As well as saving inevitable headaches, this frees you up to take care of account optimisations and making sure you’re getting the results you need. Win!
When someone takes the decision to spend their marketing budget with us, we feel this comes with a great deal of responsibility to take care of that spend as if it were our own. If our client has fought for that spend, we need to make sure it’s spent in the right way.
One of the big parts of this is having an accurate and dynamic view on run rates. Doing this on a daily basis means we can adjust spend throughout the month as needed, in full confidence that we’re not going to overspend.
Tracking budgets manually is time consuming and in a complex account opens up all sorts of opportunities for error. That is clearly not going to work out well for anyone, so budget tracking therefore makes the ideal candidate for automation.
This post runs through how we do it for all the accounts we run. It’s dead simple, so read on and have a go – for a little bit of work upfront you’ll save many, many headaches.
Connecting Your Ad Accounts to Google Sheets
We’ve covered this quite a few times, but our tool of choice is the brilliant Supermetrics. With their Google Sheets plugin you can connect to a multitude of data sources and build the reports you need in Google Sheets.

This is particularly useful for situations where you run campaigns across multiple platforms, with one central budget to track across them all.
As an example, and to keep things simple, let’s look at how to connect Google Sheets to a single Google Ads Account. Once you’ve activated the plugin, open up a new sheet, click ‘Add Ons’ find Supermetrics and then launch the sidebar. Then locate Google Ads and follow the steps to sign into your account.

Pulling in Current Month’s Data
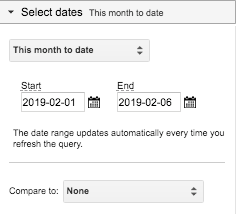
The next step is to pull the data that you’ll need to form the basis of your budget tracker. Let’s say you’ve been given the budget for a particular month, the first step is to know where you are against that budget. As a result, we’re going to need to pull in month to date spend:

Be sure to select ‘This month to date’ as your date range!
In terms of the metrics you need to pull in, you can pull in whatever you like but for budget tracking purposes we only really need ‘cost’.
Depending on how you would like to display the data you could simply pull this figure into one cell, however to help provide context we prefer to pull a view on daily spend so we can see trends and make our calculations from there.

In total, we’re going to set up three queries using Supermetrics:
- Month to date spend – total
- Month to date spend – daily view
- Yesterdays spend
Calculating Remaining Spend & Run Rate
Once you have the data you need pulling correctly into Google Sheets, the first step is to organise things into an easy to manage and maintain table. As you can see in the example below, we’ve set up a table to include:
- Monthly budget – you should know this!
- Month to date spend – pulled via Supermetrics
- Yesterday’s spend – pulled via Supermetrics
- Remaining days – calculated via Google Sheets
- Remaining budget – calculated via Google Sheets
- Forecasted spend – calculated via Google Sheets
- Remaining daily spend – calculated via Google Sheets
![]()
The outcome of the above is that we can get a clear view on the forecasted spend for the month, but more importantly what our daily spend should be in order to hit budget. We can then calculate the variance and how much we need to increase / decrease daily spending to hit our budget perfectly.
To complete the data in the table above you’re going to need a very handy Google Sheets formula which tells you how many days remain in the month:
Remaining Days:
=NETWORKDAYS.INTL(today(),eomonth(today(),0),”0000000″)
Note that because we typically pull data first thing in the morning (see below), the above formula includes the current day within the answer.
Remaining Budget:
All this requires is a very simple sum to subtract the amount spent so far from your budget:
=SUM([monthly budget])-([amount spent so far])
Forecasted Spend:
To calculate your forecasted spend (or run rate) for the month, you need to multiply yesterday’s cost by the number of remaining days in the month and then add what you’ve already spent so far. This then tells you what you’ll spend if you continue at your current rate:
=SUM([yesterday’s cost])x([remaining days])+[amount spent so far]
Remaining Daily Spend:
Once you have the above all calculated and easily accessible, remaining daily spend is a very easy figure to get. Simple divide the remaining budget by the number of days remaining in the month:
=SUM([remaining budget])/([remaining days])
Currency Conversions:
What can sometimes happen is that you’re given a budget in one currency, but the ad account you’re running from reports in another currency. We have one client where the budget is in one currency and we run campaigns on multiple platforms using an additional two currencies.
This simple formula takes a nightmare and makes it easy:
=A2*GOOGLEFINANCE(“CURRENCY:USDGBP”)
(the above example would convert the value in A2 from USD to GBP).
Automated Refreshes
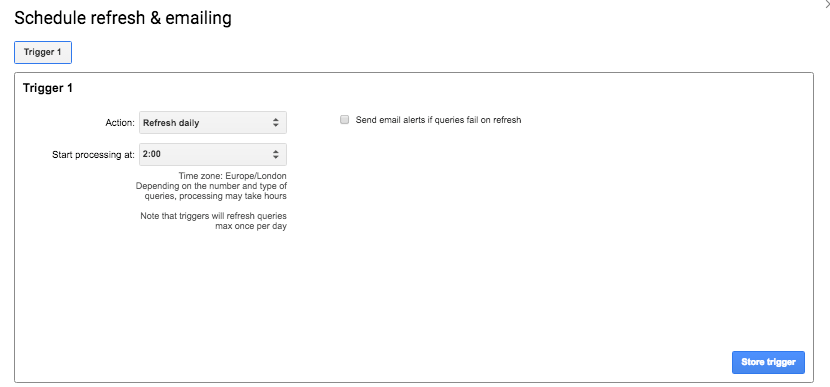
The final step is to set up automated refreshes on your report. To do this, head to ‘Add Ons’, find Supermetrics and then select ‘schedule refresh & emailing’. From there you can set your report to update as frequently as you need.

There you have it, a quick easy budget tracker that saves time and makes your life that little bit easier!


