For those of us that have used the Facebook Ads reporting feature or Google Data Studio, creating custom metrics is nothing new. However, it was impossible to create these custom metrics in the Facebook Ads Manager view…. until now.
So what is a custom metric? Essentially, this is a calculation or formula you are creating, that is not available in Facebook’s standard reporting metrics. For example, Average Order Value.
This is a feature we’ve been crying out for and now it is here, I wanted to share with you how to set your own custom metrics up and recommend a few custom metrics that will give you a lot more detailed insights into your Facebook ad campaigns.
How To Create Custom Metrics in Facebook Ads Manager
Click Columns and select Customise Columns
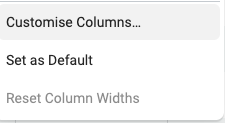
At the top of this view, you will see Create Custom Metric next to the search bar. Click this and you can get started with creating your own custom metrics.

You will now have a window appear when you can create your metrics. Here you can name, set the format (Numeric, Percentage or Currency) and construct your custom metric.
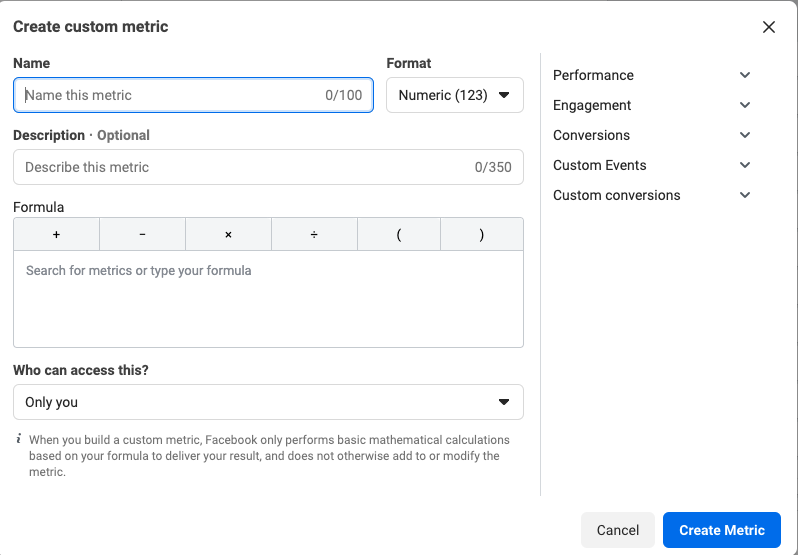
Essentially here, you are creating a formula as you would in Excel, in order to create your desired output.
So, you now know how to create your own metrics, but what should you focus on initially? Here are 5 metrics I think every DTC (direct-to-consumer) and e-commerce advertiser should be using:
1. Average Order Value
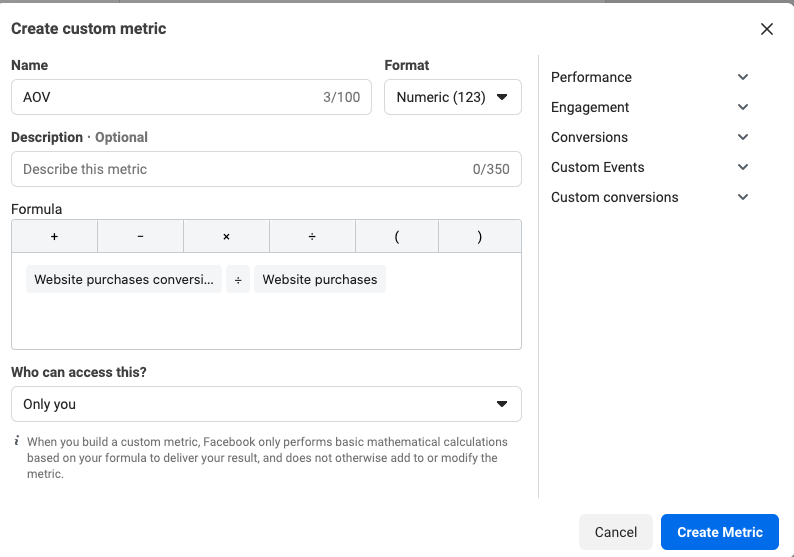
For me, knowing your AOV is an important element in understanding what is driving your ROAS. By creating this view, you will also be able to see how AOV varies between funnels and specific audiences. This can provide valuable insights into your propositions in each stage of the funnel and how you can drive AOV up overall.
For this calculation, you’ll need to divide the total revenue by number of purchases.
2. Add To Cart to Purchase Ratio
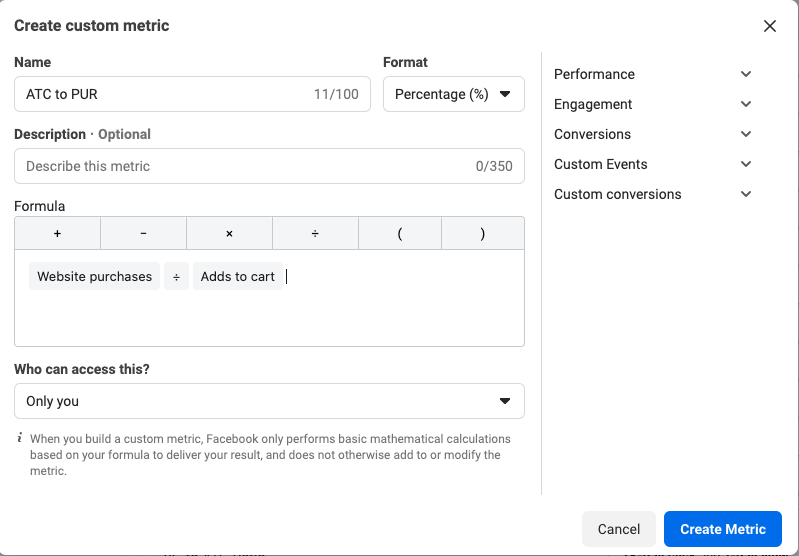
The great thing about implementing this metric into your ads manager view, is you can get a really quick understanding into whether there is a conversion rate issue during the buying journey impacting performance (for good or bad).
To create this metric you, simply need to create the following formula:
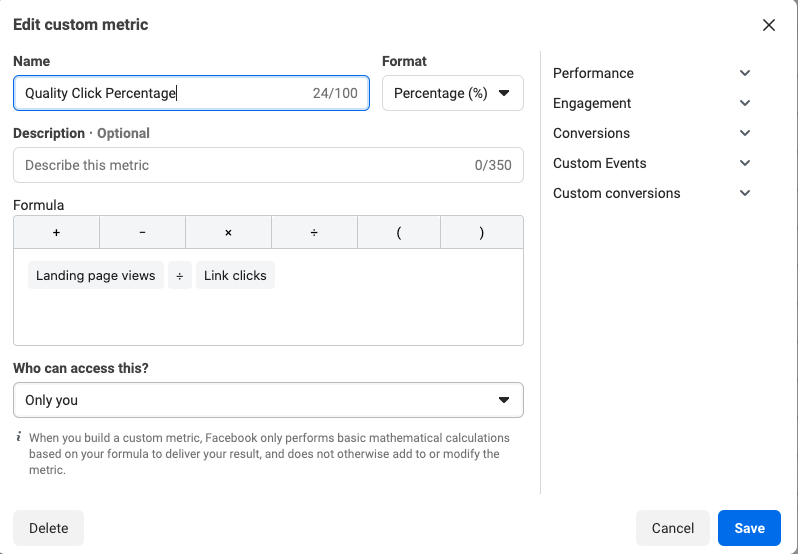
3. Quality Click Percentage
This metrics is really important as it gives you a view into how many people clicking your ads are resulting in actual landing page views. If this percentage is lower than 85%, then there could be an issue around landing page load times or the actual quality of the audience you are targeting.
For this custom metric, all you need to do is divide your total landing page views by total link clicks.
4. Thumb Stop Ratio
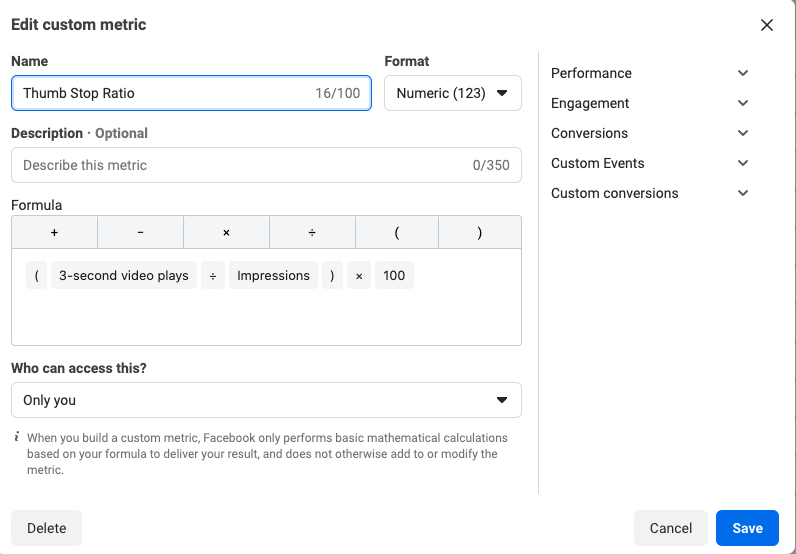
This is a phrased coined by many paid media buyers, including David Herrmann. Essentially, this metric will help you understand which video or GIF creative is doing the best job at grabbing your customers attention in the feed. This gives you even more data for your creative planning and optimisations.
If you’re achieving above 30% for your prospecting campaigns, you’re nailing the creative.
To create this custom metric, you will need the following formula:
5. Conversion Rate
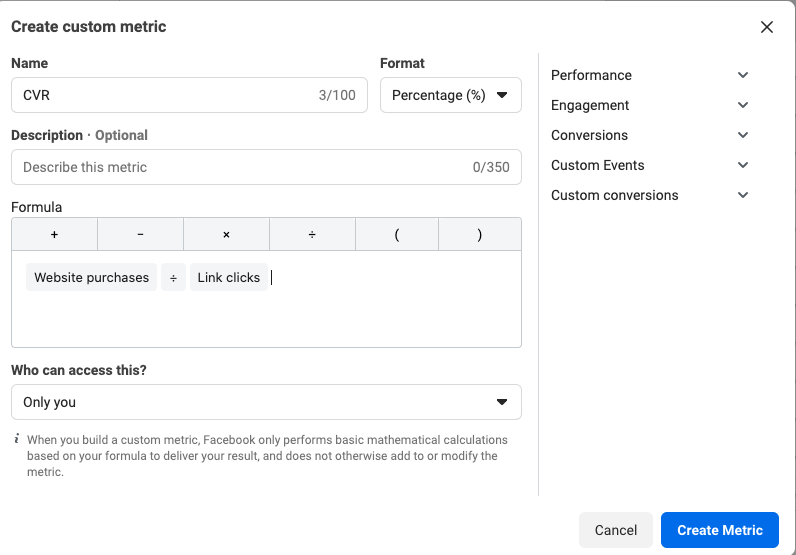
This metric is so useful, as you can easily identify which audiences or creatives are exceeding your CVR average vs what is under performing.
As you can see, custom metrics arm you with a lot more data inside the platform itself, enabling you to make better and more informed decisions. The possibilities are endless with custom metrics and for someone who loves data-driven decisions as much as me, this is a breath of much needed fresh air for the Facebook ads platform.
There is also a great thread on Twitter, which is definitely worth a read if you’re looking for some custom metric inspiration.
It would be great to hear from you about any custom metrics you are using. Feel free to leave a comment below or reach out to me on Twitter or LinkedIn.


